Index >> Business >> Investment Tools >> WinTrend
Report SpywareWinTrend 3.9

 Click to enlarge screenshot
Software Description:
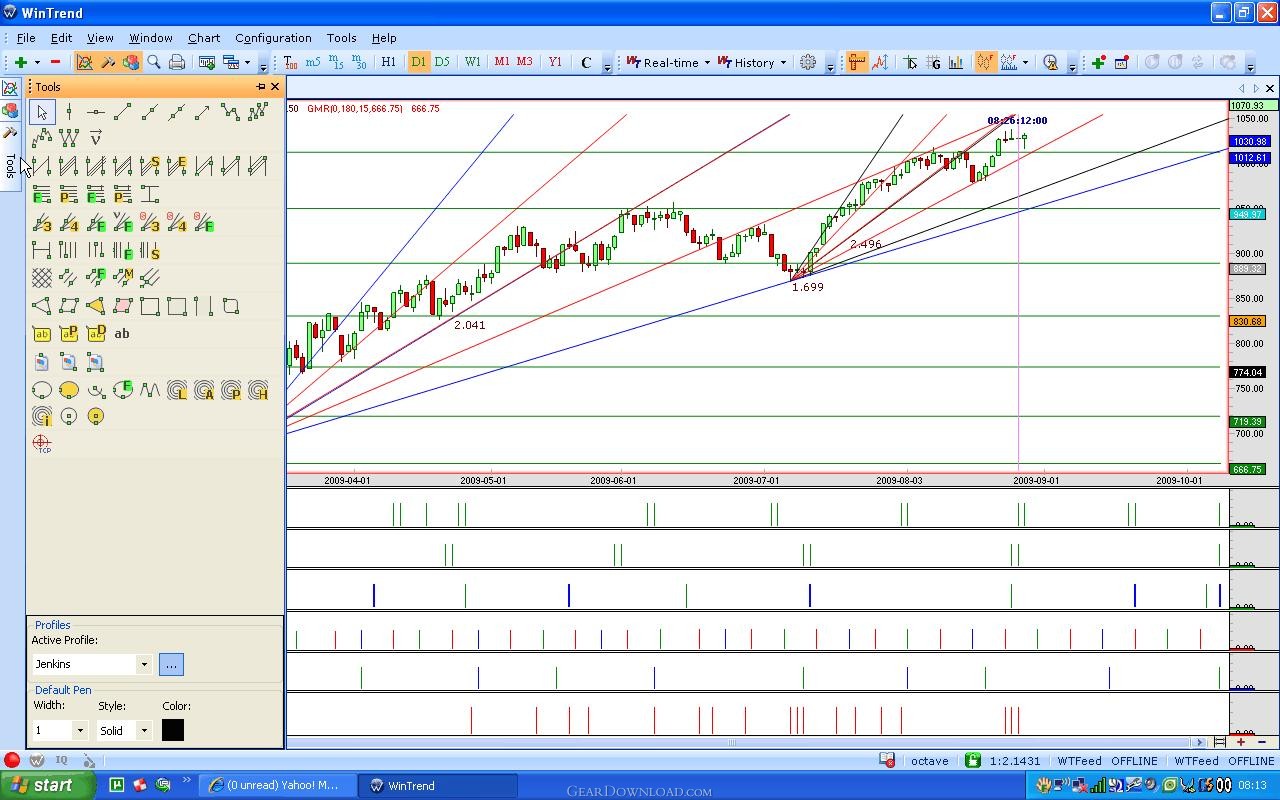
WinTrend - Free Daily Historical Data, Financial Market Charting Software
Wintrend.com is providing high quality Real-time and Historical Charting and Technical Analysis for the financial markets. Supports all types of markets: stocks, futures, indexes, spreds, currencies and options.
Wintrend has a very large set of indicators, studies and drawing tools. You can create your own custom indicators and systems using the built-in scripting language or create custom studies using free Microsoft .net competitive compiles .
Continuously updated charts as trades occur. Real-time tick by tick charting.
Create historical charts with a bar period of daily, weekly, monthly, or any number of days. Historical data for the charts is automatically downloaded with the integrated downloader. Historical daily charts are updated in real time.
Create intraday charts with any bar period. The period can be less than one day or greater than one day. The bars can be based on any period including minutes, hours, days, number of ticks/trades (Tick Charts).
200+ fully customizable technical studies and indicators. For the current list of available studies and indicators see the Technical Studies Reference.
Very easy to use advanced custom study language and interface. This allows us or users to add studies very rapidly. Often within 10 to 15 minutes.
Each study has inputs to modify the variables of the study.
Replay one or more intraday charts at any speed.
Add any number of studies to a chart.
Save a configured desktop including collection of studies and tools.
Save collection of studies to the template and apply them to a chart with one step.
Chart templates. You can also instantly duplicate a chart.
ASCII daily historical market data data can be inported and exported
Load and work with an unlimited number of chart windows. The desktop can be saved to disk and loaded with all of your previous settings. Wintrend.com
Feature List:
- Continuously updated charts as trades occur. Real-time tick by tick charting. Every tick received from the data feed is displayed and stored. Not a single tick is missed. Charts scroll automatically as new bars are added. Ticks can be stored as individual data records for highly precise Tick charts
- You can create historical charts with a bar period of daily, weekly, monthly, or any number of days. Historical data for the charts is automatically downloaded with the integrated downloader. The downloaded data is saved locally on your hard disk.. Historical charts are updated in real time
- You can create intraday charts with any bar period. The period can be less than one day or greater than one day. The bars can be based on any period including minutes, hours, days, number of ticks/trades (Tick Charts)
- All historical intraday data available from the data service server and all real-time data received from the server is stored on your computer. Whatever data is missing from the chart and is available on the server is downloaded when you connect to the data service server. The data is accumulated and can be charted at any time
- 200+ fully customizable technical studies and indicators. For the current list of available studies and indicators see the Technical Studies Reference. Please note that not all of our newer studies are listed there. We have a very easy to use advanced custom study language and interface. This allows us or users to add studies very rapidly. Often within 10 to 15 minutes
- Each study has inputs to modify the variables of the study
- Replay one or more intraday charts at any speed
- Add any number of studies to a chart
- Save a configured desktop including collection of studies and tools
- Save collection of studies to the template and apply them to a chart with one step
- Offline analysis. Charts and quotes can be displayed at anytime whether you are connected to a data source or not. Since all data downloaded and received is stored on your computer
- Automatically reconnects to the data feed if you become disconnected
- Fully adjustable regions within each chart window
- Fully customizable Vertical and Horizontal chart grid that can be hidden
- Chart Printing
- Linear, logarithmic or square root scale
- Technical study can be displayed in its own window or overlay on top of another window with or with out scale
- Show graph values for any point in the chart using the Chart Values / Chart stats tool
- Chart templates. You can also instantly duplicate a chart
- Customize colors for the chart graphics
- Load and work with an unlimited number of chart windows. The desktop can be saved to disk and loaded with all of your previous settings
- You can capture your charts or desktop and upload the images to be shared with others or for your own reference
- ASCII daily historical market data data can be inported and exported
- Murrey Math support
100% Clean:
 WinTrend 3.9 is 100% clean
This download (WinTrendSetup_release.exe) was tested thoroughly and was found 100% clean. Click "Report Spyware" link on the top if you found this software contains any form of malware, including but not limited to: spyware, viruses, trojans and backdoors.
Related Software:
- Discounted Cash Flow Analysis Calculator 2.1 - Discounted Cash Flow Analysis of 14 cash flow series with 5 discount rates.
- Visual Options Analyzer 4.5.2 - Visual Stock Options Analyzer. Build options strategies, hedging.
- AnalyzerXL 6.1.37 - Technical analysis, stock quotes, investment portfolio in Microsoft Excel
- TraderXL Pro Package 6.1.39 - All-in-one investment solution for Microsoft Excel
- Portfolio Performance Monitoring 3.0 - Monitoring and tracking the performance of a portfolio of financial assets.
- Investment and Business Valuation 3.0 - Evaluating a wide range of investment proposal and business valuation scenarios.
- GoldenGem 1.4 - Goldengem is one of the best neural net stock market programs.
- Parity Plus - Stock Charting and Technical Analysi 2.1 - Parity Plus is one of the most powerful Stock Charting and Technical Analysis Pr
- DataBull 6.2.6 - DataBull downloads stockquotes into any technical analysis software program.
- Options Czar 2.0 - Free Options Strategy Management Software
top 10 most downloaded
recommended software
-
- A VIP Organizer
- VIP Organizer is a time and task management software which uses To Do List method to help you get through more work spending less time. It increases y...

-
- Salon Calendar
- Salon Calendar is a software tool designed specially for hair salons, beauty, manicure or aesthetic shops, tanning salons, fitness studios, wedding sa...