Index >> Business >> Investment Tools >> TraderCode Technical Indicators
Report SpywareTraderCode Technical Indicators 5.0

 Click to enlarge screenshot
Software Description:
TraderCode Technical Indicators - Stock Trading Technical Indicators and Backtesting for Excel
TraderCode is a comprehensive library of technical indicators and technical analysis functions for use with Microsoft Excel. It allows you to create many types of technical indicators used in trading systems like Moving Average, Bollinger Bands, Oscillators, True Range, Standard Deviation, Donchian Channels and many more. With these indicators you can easily perform end-of-day analysis or back-testing of historical stock data.
Technical Analysis Add-In and Formulas
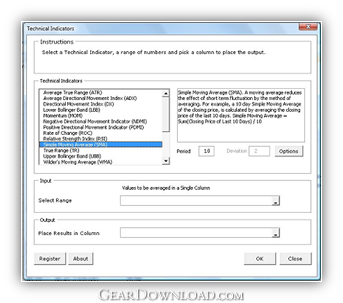
The Analysis Add-In and Formulas form the foundation of TraderCode since the first version of this popular software. The Add-In allows a user without any prior experience to quickly and easily create technical indicators from a user interface wizard. It also performs validation of the data, allows specification of where the output is to be located and guiding the user in creating the indicators accurately.
Technical Analysis Expert
The Analysis Expert is a spreadsheet model that allows you to create your own trading system based on the different technical indicators. It is able to help you download data, create multiple technical indicators, vary the parameters and repeat the tasks from within a spreadsheet environment quickly and easily. With a single click of a button, repeatable analysis can be carried out on different equity assets or stocks.
Backtesting Expert
The Backtesting Expert is a spreadsheet model that allows you to create trading strategies using the technical indicators and running the strategies through historical data. The performance of the strategies can then be measured and analyzed quickly and easily.
Point-and-Figure Charting Expert
Point-and-Figure charting is an analysis technique that has been around for many years. It has recently become very popular among traders and investors. This technical analysis technique uses a chart with "X"s and "O"s for predicting financial asset prices.
What's New: Pivot Points
TraderCode is a comprehensive library of technical indicators and technical analysis functions for use with Microsoft Excel. It allows you to create many types of technical indicators used in trading systems like Moving Average, Bollinger Bands, Oscillators, True Range, Standard Deviation, Donchian Channels and many more. With these indicators you can easily perform end-of-day analysis or back-testing of historical stock data.
Technical Analysis Add-In and Formulas
The Analysis Add-In and Formulas form the foundation of TraderCode since the first version of this popular software. The Add-In allows a user without any prior experience to quickly and easily create technical indicators from a user interface wizard. It also performs validation of the data, allows specification of where the output is to be located and guiding the user in creating the indicators accurately.
Technical Analysis Expert
The Analysis Expert is a spreadsheet model that allows you to create your own trading system based on the different technical indicators. It is able to help you download data, create multiple technical indicators, vary the parameters and repeat the tasks from within a spreadsheet environment quickly and easily. With a single click of a button, repeatable analysis can be carried out on different equity assets or stocks.
Backtesting Expert
The Backtesting Expert is a spreadsheet model that allows you to create trading strategies using the technical indicators and running the strategies through historical data. The performance of the strategies can then be measured and analyzed quickly and easily.
Point-and-Figure Charting Expert
Point-and-Figure charting is an analysis technique that has been around for many years. It has recently become very popular among traders and investors. This technical analysis technique uses a chart with "X"s and "O"s for predicting financial asset prices.
What's New: Pivot Points
Feature List:
- TraderCode is a very useful toolbox for stock traders. You can use it to compute the indicator values for stock prices and plot them in Excel
- TraderCode provides a convenient library so you can make the computations of the indicators yourself and plot and analyze them
- A built-in wizard accompanies the library, so that you can use the user interface to select ranges quickly and obtain results
- TraderCode currently supports some of the most popular and successful technical indicators used by many analysts
- As you play around with the indicators and become more experienced, you will appreciate the fact that using the different indicators to predict stock prices is like viewing the market in different angles (while suppressing other angles), and they may give very different results
- The indicators attempt to express as a formula the different relationships that many traders have abstracted over the years of their trading experiences. For example
- the relationship between prices and volume (OBV)
- the short-term price fluctations along a trend (MACD)
- stock cycles (Moving Averages applied to long term stock movements)
- You may also creatively 'invent' your own indicator using the basic set of functions provided by the TraderCode library. For example, you can try to measure the level of a stock price with respect to several of its competitors by plotting their moving averages alongside each other
- Depending on the angle you used to compute the indicators, for e.g, the window or period of analysis, you will be able to detect the buy or sell signals, overbought or oversold levels, bullish or bearish signs. The different parameters (e.g the period) that is used to compute the same indicator will predict different results under different situations
- For example, using the MACD indicator, a same point in time in the chart may sometimes indicate a bullish level when using one set of periods, while the same point may indicates a bearish level when using another set of periods. So it is important to choose the periods carefully. And even if many pairs of periods indicate an bullish level, it may still be possible that other factors not taken into account by this indicator will affect the stock price
- Also it must be stressed that the fact that multiple traders using the same indicator (with the same parameters) to predict the bullish/bearish signals and taking action as a result of the prediction will alter the outcome itself
- Thus, understanding these indicators and applying them appropriately will give you a more accurate picture of the market, and TraderCode is the ideal tool for doing so
- The technical indicators currently implemented by TraderCode include
- Accumulation / Distribution Line (ADLINE)
- Average Directional Movement Index (ADX)
- Average True Range (ATR)
- Chaikin Money Flow (CMF)
- Commodity Channel Index (CCI)
- Directional Movement Index (DX)
- Donchian Lower Band
- Donchian Middle Band
- Donchian Upper Band
- Exponential Moving Average (EMA)
- Fibonacci Extension (FIBE)
- Fibonacci Retracement (FIBR)
- Fibonacci Fan (FIBF)
- Linear Regression Indicator (LRI)
- Lower Bollinger Band (LBB)
- Momentum (MOM)
- Money Flow Index (MFI)
- Moving Average Convergence/Divergence (MACD)
- Negative Directional Movement Indicator (NDMI)
- On Balance Volume (OBV)
- Percentage Price Oscillator (PPO)
- Percentage Volume Oscillator (PVO)
- Positive Directional Movement Indicator (PDMI)
- Rate of Change (ROC)
- Relative Strength Index (RSI)
- Simple Moving Average (SMA)
- Sine Weighted Moving Average (SWMA)
- Stochastic Oscillator (%K)
- Triangular Moving Average (TMA)
- True Range (TR)
- Upper Bollinger Band (UBB)
- Wilder's Moving Average (WMA)
- Williams %R
100% Clean:
 TraderCode Technical Indicators 5.0 is 100% clean
This download (TechnicalIndicators.exe) was tested thoroughly and was found 100% clean. Click "Report Spyware" link on the top if you found this software contains any form of malware, including but not limited to: spyware, viruses, trojans and backdoors.
Related Software:
- TinyGraphs 1.0 - Open source add-in that creates sparklines for Excel
- Free Loan Amortization Schedule 1.0 - Free Loan Amortization Schedule
- Free Investment and Financial Calculator 1.0 - Free Investment and Financial Calculator - TVM, NPV, IRR
- Discounted Cash Flow Analysis Calculator 2.1 - Discounted Cash Flow Analysis of 14 cash flow series with 5 discount rates.
- Visual Options Analyzer 4.5.2 - Visual Stock Options Analyzer. Build options strategies, hedging.
- AnalyzerXL 6.1.37 - Technical analysis, stock quotes, investment portfolio in Microsoft Excel
- TraderXL Pro Package 6.1.39 - All-in-one investment solution for Microsoft Excel
- Portfolio Performance Monitoring 3.0 - Monitoring and tracking the performance of a portfolio of financial assets.
- Investment and Business Valuation 3.0 - Evaluating a wide range of investment proposal and business valuation scenarios.
- GoldenGem 1.4 - Goldengem is one of the best neural net stock market programs.
top 10 most downloaded
recommended software
-
- A VIP Organizer
- VIP Organizer is a time and task management software which uses To Do List method to help you get through more work spending less time. It increases y...

-
- Salon Calendar
- Salon Calendar is a software tool designed specially for hair salons, beauty, manicure or aesthetic shops, tanning salons, fitness studios, wedding sa...